
|
|
|
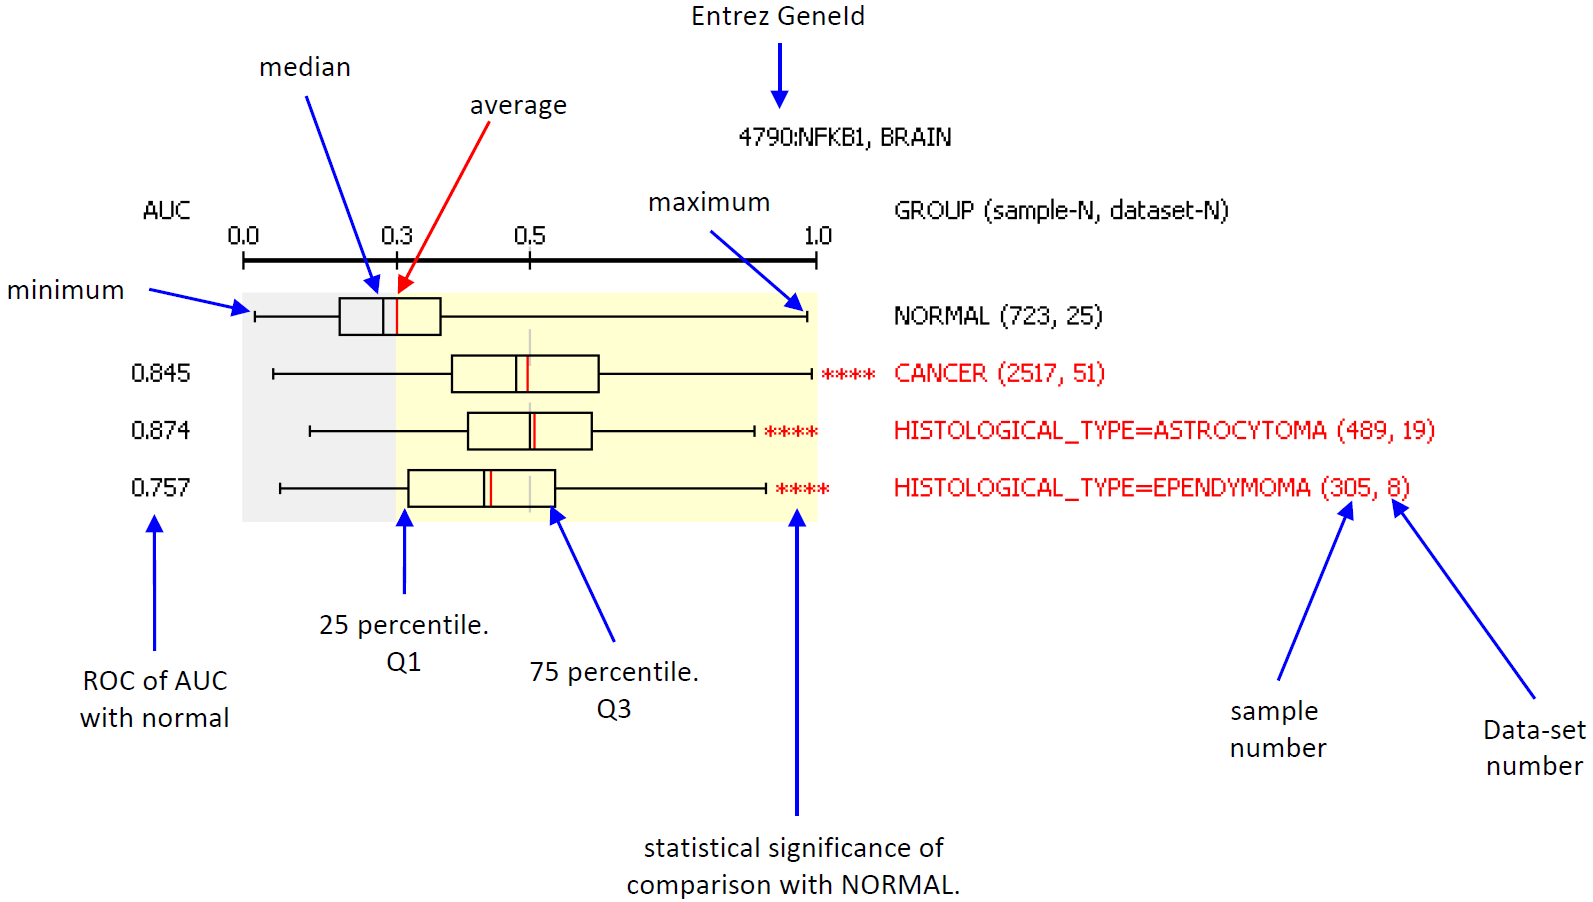
Help of Oncopression. Figure Legend Each element of bar plot (box-whisker) has the meaning: 
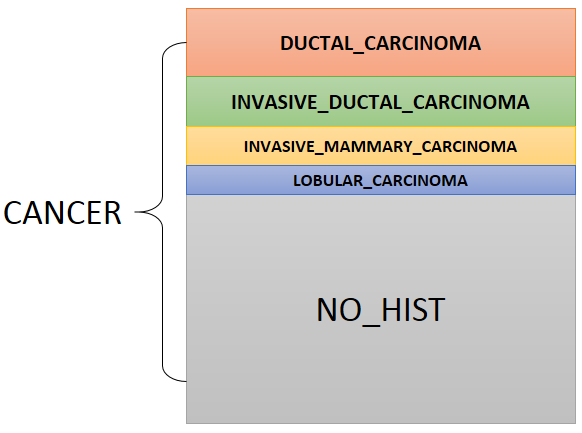
Intepreting results from small number of data-sets We remind users of oncopression that results made from small number of data-sets are likely to be inaccurate and to have bias regardless of total sample number. That is, for the two cases: case 1) sample number 100 from 5 data-sets, case 2) sample number 200 from 1 data-set, the case 1) is more reliable than case 2) even though it has small number of total samples. There is no definitive number of data-sets enough for interpretation, but we recommend 3 as the minimum number data-sets for reliable conclusion. Results made from one or two data-sets should be regarded as temporary and preliminary until more data-sets are included. The number of asterisk means statistical significance of comparison with NORMAL group: *: p-value < 0.05 **: p-value < 0.01 ***: p-value < 0.001 ****: p-value < 0.0001 by the Student's t-test. The red asterisk * means over-expression of the gene in the group, and blue asterksk * does under-expression when compared to NORMAL. All cancer data in Oncopression have their matched normal samples. UPC-normalized gene expression value ranges 0 to 1.0 where 0.0 indicates no expression and 1.0 the strongest expression among other genes. Range above average expression in NORMAL is filled with light-yellow color. We also provide classification performance of expression level between normal and cancer or sub-group of cancer to corroborate Student's t-test results. The student's t-test result seems over-estimated (smaller p-value than that it should be) as sample number increases. We used well-known Area Under Curve of Receiver-Operating Curve (AUC of ROC) as the metric for classification. Simply speaking, AUC of ROC = 0.5: pure random, 0.5 < AUC of ROC < 0.7 : bad performance, 0.7 < AUC of ROC < 0.8 : not bad, but not good perforamnce, 0.8 < AUC of ROC < 0.9 : relative good performance, 0.9 < AUC of ROC : good performance, AUC of ROC = 1.0 : perfect classification, no overlap of values between two groups. Group Information All cancer data in Oncopression have their matched normal data with named NORMAL. In case of SARCOMA, there are three types of normal data: 1) skeletal muscle for LEIOMYOSARCOMA, 2) adipose tissue for LIPOSARCOMA, and 3) synovial tissue for SYNOVIAL_SARCOMA. For each tissue, CANCER group contains all cancer samples. The histological group is the primary grouping criterion of cancer samples. For example, the following figure describes breast cancer grouping by histology.  Among the samples, some have information such as tumor grade, stage, patient age, etc. Samples with such information are grouped according to the information. Therefore, each subgroup is a part of CANCER. The order of group is + NORMAL, + CANCER, + CANCER-LIKE, + Histological sub-groups, + others. Histological sub-groups are dependent on tissue. CANCER, NOHIST means group of all samples without histological sub-group information. CANCER-LIKE group contains sample of adenoma, dysplasia, metaplasia, and similar cases that are thought cancer-prone but not cancer itselt yet. Note for GLIOBLASTOMA of Brain tumor: Glioblastoma is histologically grade 4 astrocytoma, but I separated glioblastoma from other astrocytoma and considered it as independent histological type because more than half of astrocytoma samples are glioblastoma. The value 0 in group name indicates the group has no attribute value. For example, MUTATION:BRAF=0 means the group consists samples with no BRAF mutation according to their original annotation. On the other hands, the value 1 indicates the group has the attribute. For instance, MUTATION:BRAF=1 means samples in the group have BRAF mutation. Samples without information about BRAF mutation are not included in both MUTATION:BRAF=0 and MUTATION:BRAF=1. The meaning of attribute name are: + MUTATION: Mutation, + METHYLATION: Promoter methylation state, + LOH: Loss of heterozygosity, + AMPLIFICATION: Gene amplification state, + HISTOLOGICAL_FEATURE: Extra information. System of tumor stage and grade are dependent on tissue-type. In case of TNM-Stage, TUMOR_STAGE:PTNM means pathological TNM Stage. Tumor grade are defined by differentiation state in some tissue, but the two information are not merged in Oncopression, instead, the two information are seperately provided by TUMOR_GRADE and DIFFERENTIATION_STATE as in original source data. LYMPH_NODE_STATE indicates metastasis state in adjacent lymph-node. |